Appendix V: the 1910 census and the 1911 election
This appendix draws on data from the official reports of the 1910 census in Austria and the election that followed it in 1911; both being the last before the Empire disintegrated. There were censuses in 1920 and 1923 but the next believable census was in 1934. It shows that the commonly-accepted ethnic distribution maps are over-simplified - for example, there are 126 permissible language-Land combinations and the only two not recorded are Romanian in Krain and Magyar in Kärntnen. This provides a background against which to consider the various plebiscites held as WWI ended.
A perennial problem in Austria was the classification of the populace: should this be by declared ethnic origin irrespective of place of domicile; or by place of domicile irrespective of preferred language, or what? A satisfactory answer - ie one that people didn't take up arms over - never really emerged.
The 1910 census
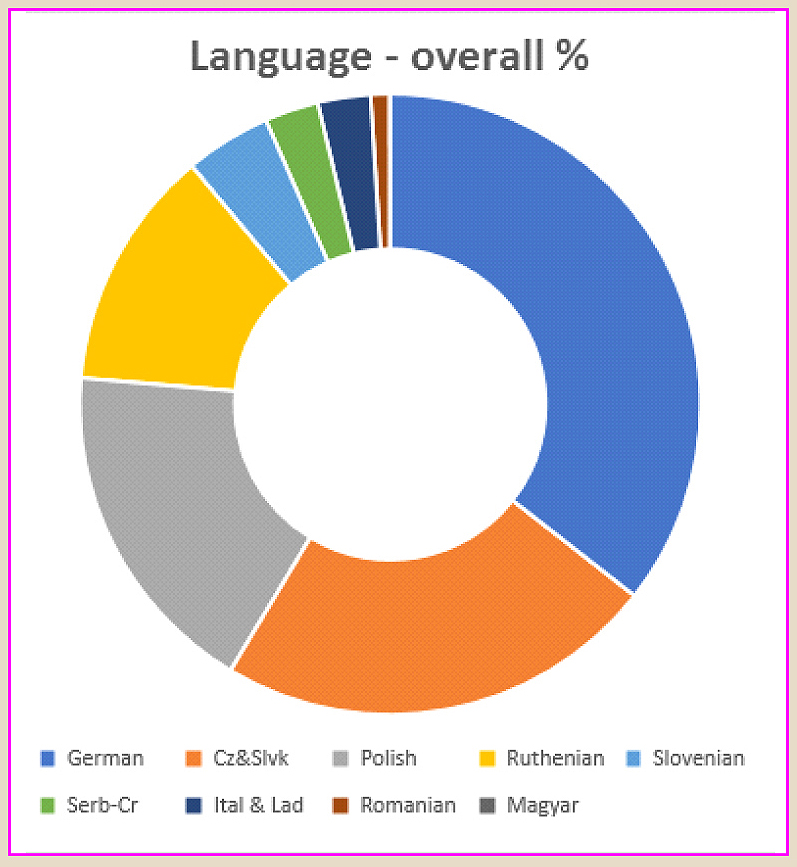
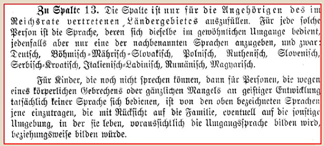 There was a census in Austria-Hungary in 1910 in which people were required to declare in column 13 which of a stated list of nine language-groups or Nationalities they belonged to. You had to choose between German, Bohemian-Moravian-Slovakian, Polish, Ruthenian, Slovenian, Serbo-Croat, Italian and Ladenish, Romanian, and Hungarian. "None of the above" doesn't seem to have been an acceptable reply.
The raw census data was in part processed by Hollerith machines, which had been introduced for the 1890 census by Elektrotechniker Theodor Heinrich Otto Schäffler. The actual results of the 1910 census for "Austria" (Cisleithiana) are on the inestimable ANNO site. Note that the page numering restarts for the tables that follow the discussions. See also the German site
Wikipedia, which I haven't checked against the official version on ANNO.
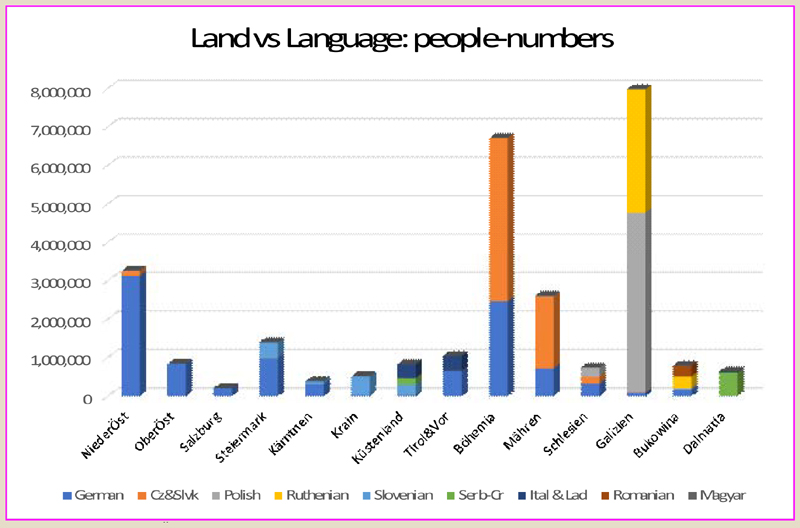
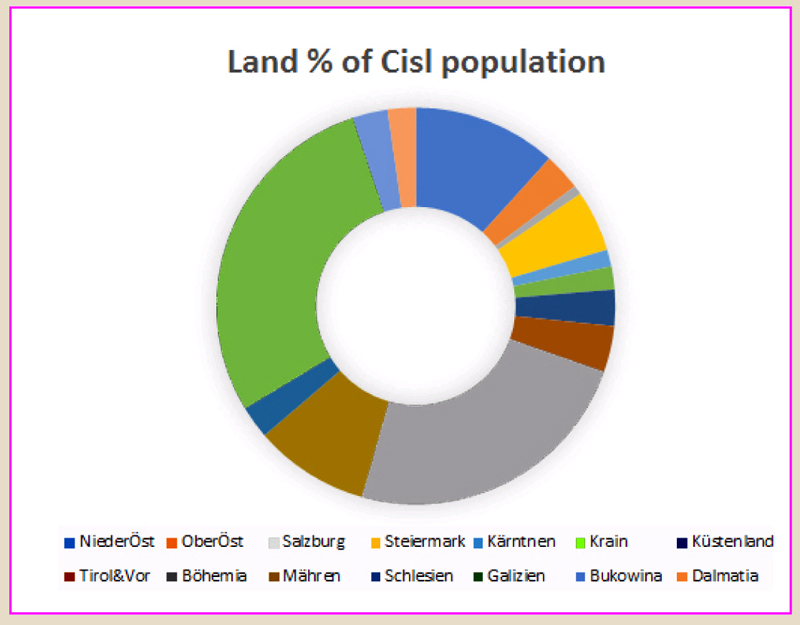
This table gives the data for language vs Land.
| Land | German | Cz&Slvk | Polish | Ruthenian | Slovenian | Serb-Cr | Ital&Lad | Romanian | Magyar | Row total |
| NiederÖst | 3,130,536 | 122,329 | 5,601 | 2,316 | 1,380 | 429 | 1,084 | 139 | 296 | 3,264,110 |
| OberÖst | 840,604 | 1,953 | 356 | 96 | 81 | 3 | 33 | 4 | 16 | 843,146 |
| Salzburg | 208,009 | 189 | 33 | 6 | 176 | 11 | 136 | 1 | 1 | 208,562 |
| Steiermark | 983,252 | 971 | 178 | 80 | 409,684 | 151 | 361 | 7 | 15 | 1,394,699 |
| Kärntnen | 304,287 | 358 | 96 | 7 | 82,212 | 28 | 82 | 2 | 0 | 387,072 |
| Krain | 27,915 | 750 | 89 | 19 | 490,978 | 205 | 369 | 0 | 2 | 520,327 |
| Küstenland | 29,077 | 2,689 | 517 | 179 | 266,614 | 170,773 | 356,495 | 901 | 24 | 827,269 |
| Tirol&Vor | 651,858 | 4,372 | 414 | 267 | 609 | 60 | 391,557 | 15 | 17 | 1,049,169 |
| Bohemia | 2,467,724 | 4,241,918 | 1,541 | 1,062 | 292 | 190 | 136 | 33 | 48 | 6,712,944 |
| M�hren | 719,435 | 1,868,971 | 14,924 | 563 | 103 | 767 | 43 | 9 | 42 | 2,604,857 |
| Schlesien | 325,523 | 180,348 | 235,224 | 255 | 45 | 3 | 41 | 3 | 14 | 741,456 |
| Galizien | 90,114 | 8,718 | 4,672,500 | 3,208,092 | 144 | 44 | 21 | 740 | 104 | 7,980,477 |
| Bukowina | 168,851 | 1,005 | 36,210 | 305,101 | 80 | 1 | 36 | 273,254 | 10,391 | 794,929 |
| Dalmatia | 3,081 | 1,412 | 301 | 811 | 542 | 610,669 | 18,028 | 7 | 4 | 634,855 |
| Col total | 9,950,266 | 6,435,983 | 4,967,984 | 3,518,854 | 1,252,940 | 783,334 | 768,422 | 275,115 | 10,974 | 27,963,872 |
Several informative maps are appended to
Volume 1 of the official census report, two of which are shown next. They give a representation of the distribution of the minority languages.
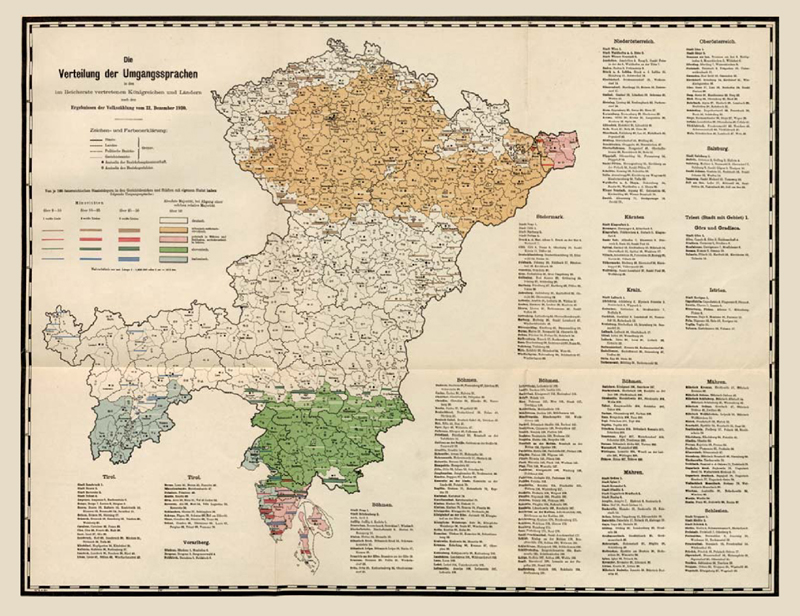
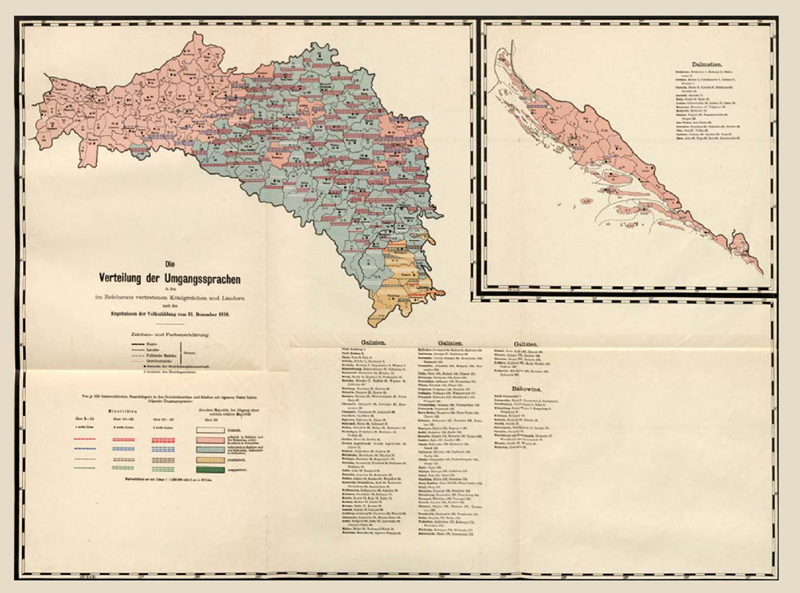
The originals are high resolution, being 7x8½ inches at 1250 pixels-per-inch! They are here:
Map 1 and Map 2 of the official census report! Huge, but readable.
For comparison, here is a "conventional" map, self-described in the right margin as "Distribution of races in Austria-Hungary"
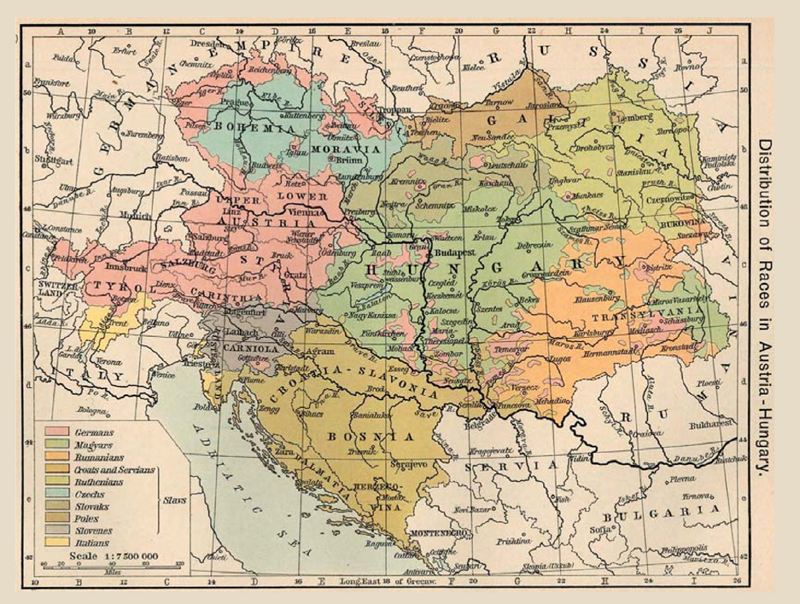
A problem with all such ethnic-groups-distribution maps is that they suggest hard boundaries. Furthermore, the actual census data records preferred language, and it may be an unjustified assumption to equate that to "ethnic group". Defining them as identical risks circularity of argument - and how do you classify the solitary Magyar speaker living in Salzburg? Now there's a problem for fractal analysis! Or a few evenings with Austrian National Library On-line partnered with Excel. (Nieder�st includes Vienna. The hairy edges of the bars are a computer artefact!)
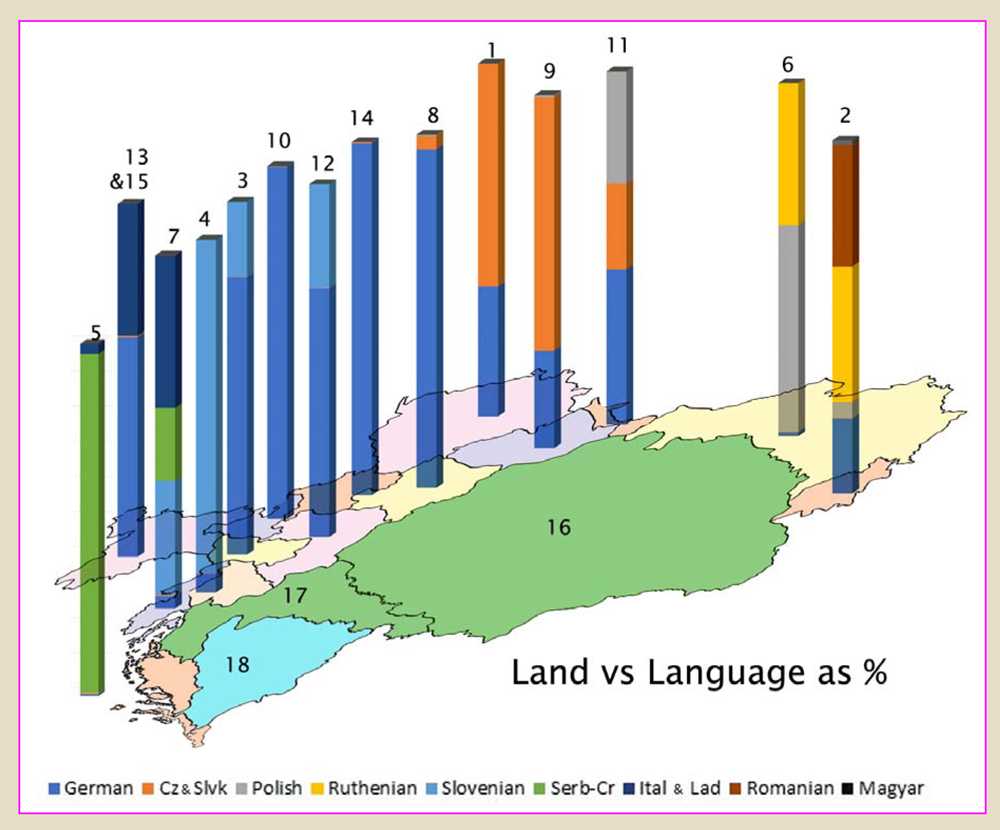
Cisleithania: 1: Bohemia, 2: Bukovina, 3: Carinthia, 4: Carniola, 5: Dalmatia, 6: Galicia, 7: K�stenland, 8:
Lower Austria, 9: Moravia, 10: Salzburg, 11: Silesia, 12: Styria, 13: Tyrol, 14: Upper Austria, 15: Vorarlberg.
Transleithania: 16: Hungary proper; 17: Croatia-Slavonia. 18 is Bosnia and Herzegovina.
Elections
In the decades following 1868, increasingly desperate attempts were made to find a system of government that would maintain the integrity of the Austro-Hungarian Empire while placating the numerous nationalities that lived within its borders. Franz Joseph's attempts to keep the lid on the pressure cooker were frustrated by the Czechs, Poles and others busily stoking the fires underneath.
On 3 November 1905, Franz Joseph announced that he had decided to introduce general suffrage, hoping that the new voters would be less intransigent than the existing. The constituencies were carefully crafted in favour of the Gemans and the Poles, and an election was held in May 1906. The results were a strong swing to the left, not exactly what the Emperor had hoped for! Nevertheless, a nominally parliamentary government spluttered on.
A new election was called in May 1911, in the forlorn hope of a better result. Increasingly the business of government had to be achieved by administrative decree ("paragraph 14"), and in March 1914 the Reichsrat was adjourned, remaining so when the war began.
The 1911 election
The election was called by law 1911 RGB062, which gave details of when each part of the Austrian Empire should vote but not of who was entitled to vote. The first paragraph carefully calls the election separately for each of the parts of the Empire: The Kingdom of Bohemia; The Archduchy of Lower Austria; The Archduchy of Upper Austria; The Duchy of Salzburg; and so on until The City of Trieste and its surroundings.
The detailed regulations for voting, and the penalties if you didn't, were issued by the local government of each separate Land and are to be found in their Land Gesetz und Verordnung Blatt, not the Reichsgesetzblatt. See for example the decree of 11 April 1907 for Upper Austria. Citizenship in the Austrian Empire came later than the right-of-residence, and for the lower classes that was preceded by the compulsion-to-reside: until 1781 a peasant could not leave his Lord's domain without permission. See "Katherina Graber", which is a document recording the official court permission to Katherina Graber of Kitzbühel to emigrate to and marry in the separate country of Salzburg in 1787.
"Heimatrecht", introduced in 1859, gave the right of residence in a town or district; your name would be entered on a register. This gave you citizenship of the Land where the town or district was; in 1867 this became citizenship of Cisleithiana (allgemeines österreichisches Staatsbürgerrecht). The "universal suffrage" of 1906 actually applied only to all adult males with Heimatrecht - which you couldn't hold in both Cis- and Transleithiana (so if you had the right to vote in Austria you could not also vote in Hungary; and conversely).
The table-of-results below uses the layout and party names from the Wikipedia article on the Cisleithanian legislative election in 1911 but takes its data from the Official Report which is slightly different, as discussed below the table. The electorate was divided into "Nations" which were named as Croatian; Czech; German; Italian; Polish; Ruthenian (ie Ukrainian); Serb; Slovenian; Romanian; and None. That's nine Nations plus None; however they differ from the nine language-groups of the 1910 census in that the Serbo-Croat Group has been split into two Nations, and there is no Hungarian Nation. The 1910 census lists only 10,974 Hungarian speakers in the whole of Cisleithania - perhaps there weren't enough Hungarian voters with Cisleithianian Heimatrecht, or no candidates stood from a Hungarian party?
| Nation | Party | Votes | Actual subtotal | % of votes cast |
| Croatian | Croatian Party | 33,565 | 82,918 | 0.75% |
| Pure Justice Party | 28,254 | 0.63% |
| Croatian nationals | 20,770 | 0.46% |
| Social Democratic Party | 329 | 0.01% |
| Czech | Social Democratic Party Autonomists | 357,234 | 1,094,021 | 7.99% |
| Agrarian | 257,717 | 5.77% |
| Catholic nationals | 128,056 | 2.86% |
| Czech National Social Party | 95,901 | 2.15% |
| Christian Social Party | 83,124 | 1.86% |
| Young Czech Party | 56,673 | 1.27% |
| Progressive People's Party | 34,443 | 0.77% |
| Progressive Constitutionalists | 20,881 | 0.47% |
| Old Czech Party | 9,872 | 0.22% |
| Social Democratic Party Centralists | 19,374 | 0.43% |
| Czech nationals | 1,893 | 0.04% |
| Czech Realist Party | 4,984 | 0.11% |
| Independents | 10,832 | 0.24% |
| Traders Party | 3,201 | 0.07% |
| Zählkandidaten | 9,836 | 0.22% |
| German | Christian Social Party | 608,346 | 1,673,189 | 13.61% |
| Social Democrats | 542,549 | 12.14% |
| Agrarians | 106,548 | 2.38% |
| German Radicals (Free All Germans) | 90,523 | 2.02% |
| German People's Party | 71,882 | 1.61% |
| German Progress Party | 71,114 | 1.59% |
| German-National Party | 28,689 | 0.64% |
| German Workers' Party | 26,670 | 0.60% |
| Upper Austria Farmers' Club | 22,009 | 0.49% |
| All Germans | 20,527 | 0.46% |
| German Miner and Farmers' Association | 15,301 | 0.34% |
| Independents | 14,934 | 0.33% |
| Conservatives | 14,597 | 0.33% |
| Independent Christian Socials | 10,299 | 0.23% |
| Z�hlkandidaten | 7,569 | 0.17% |
| Central Industrial Committee | 6,422 | 0.14% |
| Free Socialists | 4,074 | 0.09% |
| German Conservative Farmers' Party | 3,623 | 0.08% |
| Economic Political Realm Party | 2,885 | 0.06% |
| Social Politicians | 2,735 | 0.06% |
| German Economy Party | 1,893 | 0.04% |
| Italian | National-Liberals | 41,928 | 115,906 | 0.94% |
| Popular Political Union of Trentino | 40,543 | 0.91% |
| Social Democratic Party | 23,068 | 0.52% |
| Democrats | 321 | 0.01% |
| Independents | 436 | 0.01% |
| Italian nationals | 5,925 | 0.13% |
| Liberal Farmers' Association | 3,685 | 0.08% |
| Polish | People's Party | 185,674 | 672,884 | 4.15% |
| Conservatives | 137,199 | 3.07% |
| National Democrats | 98,460 | 2.20% |
| Democrats | 84,181 | 1.88% |
| Social Democratic Party | 64,569 | 1.44% |
| Independents | 38,028 | 0.85% |
| Centre | 23,139 | 0.52% |
| Christian Social Party | 21,982 | 0.49% |
| Agrarian | 0 | 0.00% |
| Independent Socialists | 6,515 | 0.15% |
| National Party | 0 | 0.00% |
| Non-party Democrats | 4,302 | 0.10% |
| Pro-German Poland | 5,902 | 0.13% |
| Progressive Democrats | 2,933 | 0.07% |
| Ruthenian | Ukrainian Party | 326,955 | 531,434 | 7.31% |
| Russian National Party | 128,160 | 2.87% |
| Ukrainian Radical Party | 54,701 | 1.22% |
| Social Democratic Party | 21,618 | 0.48% |
| Serb | Serbs | 11,460 | 11,460 | 0.26% |
| Slovenian | People's Party | 54,089 | 170,356 | 1.21% |
| Clerical | 43,203 | 0.97% |
| Liberals | 33,170 | 0.74% |
| Independents | 3,408 | 0.08% |
| National Progressives | 0 | 0.00% |
| Pro-German Slovenians | 5,260 | 0.12% |
| Slovenian nationals | 16,858 | 0.38% |
| Social Democratic Party | 14,368 | 0.32% |
| Romanian | Romanian national Party | 38,408 | 55,946 | 0.86% |
| Independents | 5,728 | 0.13% |
| Romanian national Democratic Party | 11,810 | 0.26% |
| None | Zionists | 31,781 | 31,781 | 0.71% |
| Unknown (Unbekannt oder zersplittert) | 30,453 | 30,453 | 0.68% |
| | Total of column | 4,470,348 | 4,470,348 | 100.00% |
The parties who had enough votes to obtain one or more seats combined together into Associations or Clubs, with total seats of:
| Grouping | Seats | Grouping | Seats |
| Bohemian Social Democrats | 25 | Independents | 23 |
| Christian Social Union | 73 | Latin Union | 21 |
| Croatian-Slovenian Club | 27 | Poland Club | 70 |
| Dalmatian Club | 7 | Polish Social Democrats | 9 |
| German National Association | 100 | Ukrainian Association | 28 |
| German Social Democrats | 49 | Uniform Bohemian Club | 84 |
| | Total | 516 |
Errors?
The Wikipedia article has two transcription errors, and more seriously the sum of the tabulated votes does not equal the total stated at the end, nor are the percentages correct. Even worse, the official record also contains errors and inconsistencies. Using the distribution table on its Heft 1 pages 6 & 7, the arithmetically-correct subtotal for the "German" votes is 1,673,189 (as in my table above) while the printed subtotal is 1,739,927 which is 66,738 more. This increases the grand total of votes to the 4,537,086 printed in their table. However, their previous page gives the votes split by Land, and the total of votes cast as 4,625,082 from an electorate of 5,767,065.
©APS. Last updated 6 August 2024